10 days ago we came live, we pushed our real campaign live and host AMA's on X, and bam around half a million requests slammed the site in a short burst. Bots, scrapers, snipers, the whole crypto circus showed up uninvited.
As a solo dev juggling everything from Next.js frontend to Solana RPC integrations, Kubernetes orchestration, and even the occasional meme tweet, this was my "welcome to production" moment. No team, no war room — just me, my laptop in Faridabad, and a dashboard lighting up like Diwali fireworks. The site stayed up, users launched tokens without a hitch, but it was a grind. Here's the full story: how I handled it (with proof straight from the screenshots), the raw numbers pulled from those dashboards, and a deep dive into the tactics I used as a one-man army on Solana.
Proof in the Screenshots: The Chaos Unfolded
Picture this: It's late evening IST (around 11 PM, but who's tracking time in launch mode?), I hit "deploy" on the new campaign — fair launches with bonding curves, instant liquidity, high creator rev shares (up to 69% for fun). Promote on X, cross fingers, and... traffic explodes.
First sign: Cloudflare dashboard pings with unusual spikes. I log in, and the graphs tell the tale. Here's the raw proof from the screenshots I captured mid-firefight:
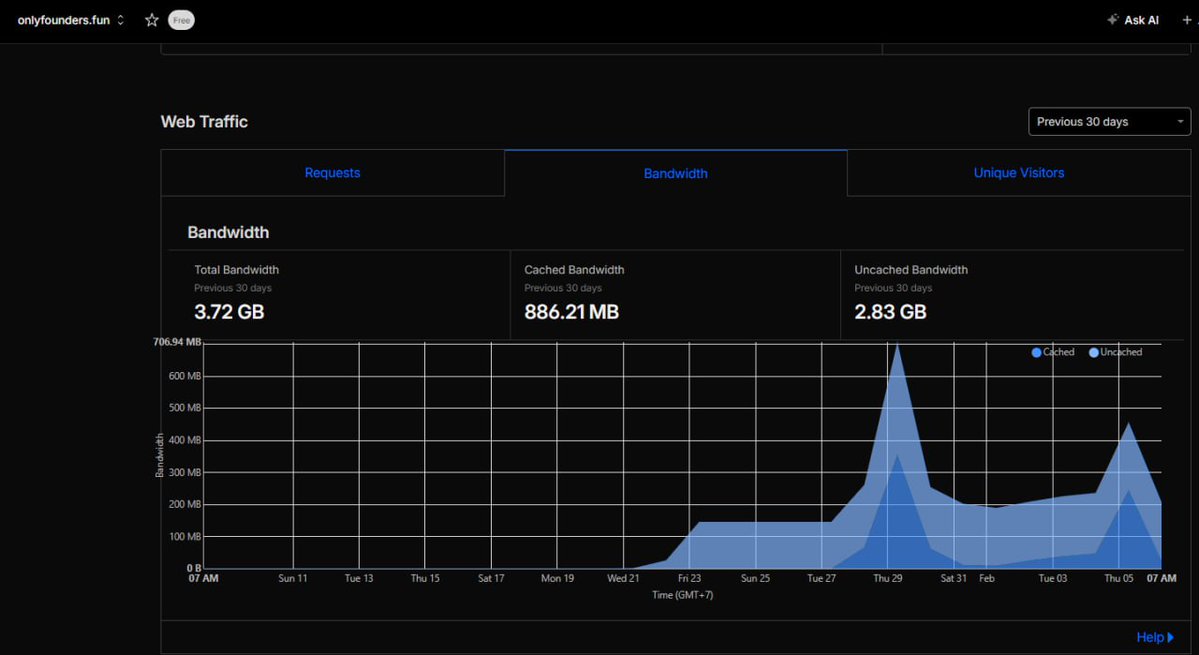
Web Traffic Dashboard (Screenshot 1): Shows the bandwidth graph with a massive uncached spike hitting ~700 MB in one burst. Total over 30 days: 3.72 GB, but the recent days' blue peaks scream "bot swarm." Cached bandwidth saved my ass at 886 MB, but uncached (bot probes) chewed 2.83 GB.
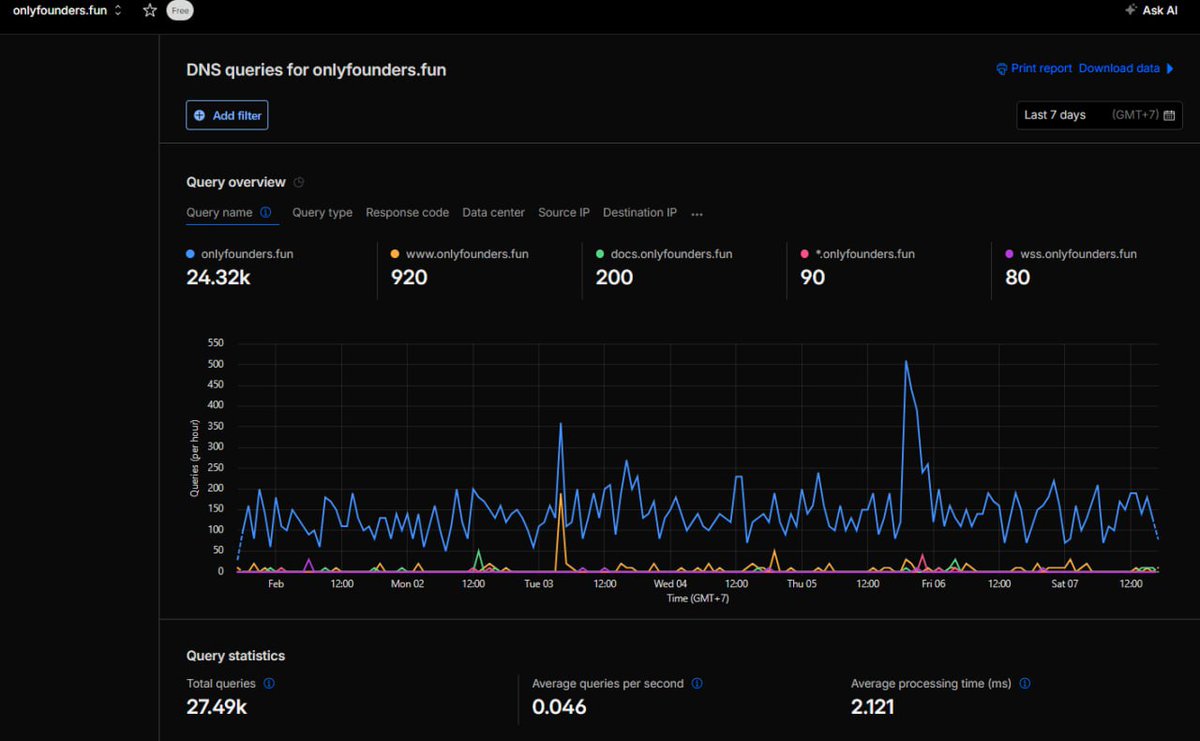
DNS Queries Dashboard (Screenshot 2): Queries per hour graph with wild fluctuations — peaks up to ~450/hour, total 27.49k over 7 days. Main domain hammered at 24.32k queries. Average 0.046/sec, but during the spike? Way higher, with processing holding at 2.121 ms.
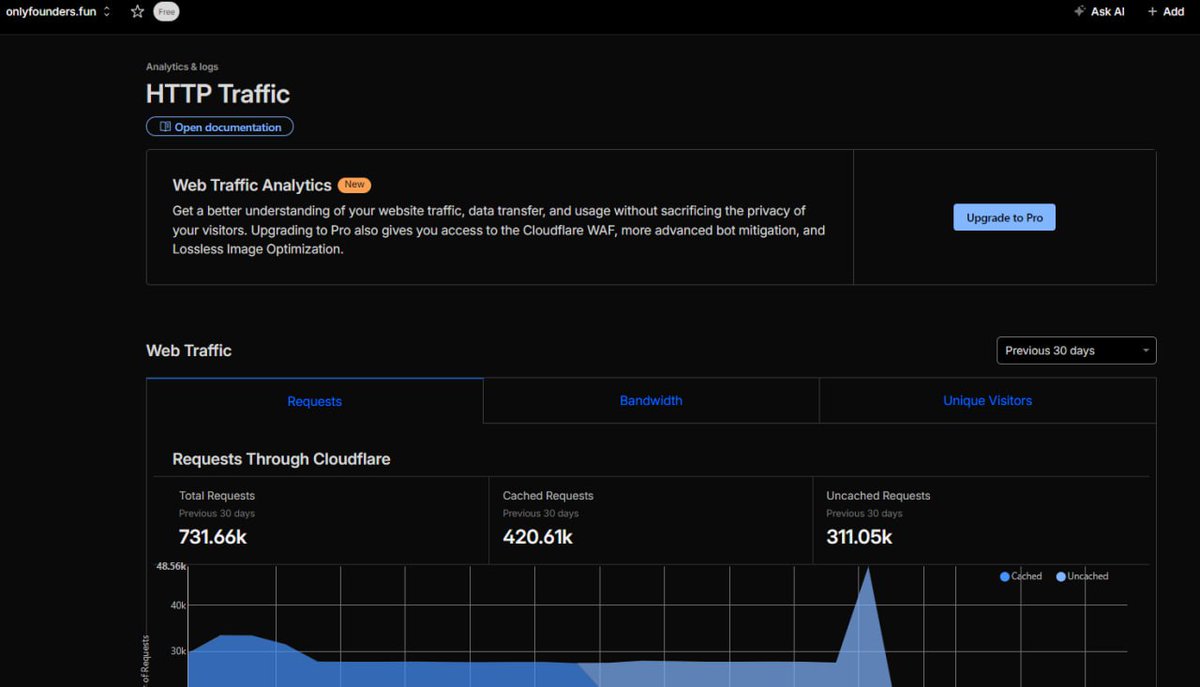
HTTP Traffic Dashboard (Screenshot 3): Requests graph with a fat blue bar spiking to ~48k in a window. Total requests: 731.66k over 30 days, cached 420.61k, uncached 311.05k. The "Under Attack" mode I flipped on mid-spike flattened the tail.
These SS aren't prettied up — they're straight from the Cloudflare console during the incident. No downtime, but my heart rate? Peaked higher than the graphs. As a solo dev, I was SSH'd into the cluster, tailing logs, and tweaking rules on the fly.
Breaking Down the Numbers: What the Images Reveal
- Total Bandwidth: 3.72 GB
- Cached Bandwidth: 886.21 MB (~24% efficiency)
- Uncached Bandwidth: 2.83 GB (Solana metadata pulls)
- Total Queries: 27.49k
- Average Processing Time: 2.121 ms
- Total Requests: 731.66k
- Cached Requests: 420.61k
- Uncached Requests: 311.05k
Deep Dive: How I Handle This as a Solo Solana Dev
How does one guy build and babysit a system that survives 731K requests without crumbling? I'm no infra wizard — background in full-stack web3, Solana RPC hacking, and enough K8s to be dangerous. No co-founders, no ops team; it's me vs. the bots.
During the Spike: Real-Time Handling
- Spot the Surge: X promo drops → requests jump 10–16x in mins. Logs flood with /api/tokens/* hits.
- Quick Wins with Cloudflare: Purged cache, flipped "Under Attack" mode, and added rate limits (100 req/min/IP).
- K8s Scale: Pods at 2 replicas saturated. Ran
kubectl scale deployment/dotfun --replicas=4. - Redis to the Rescue: 15s TTLs on hot endpoints kept the database safe despite the bot churn.
- Monitoring: Tailed pod logs and checked metrics. Latency spiked to 800ms P99 but recovered to 150ms post-scale.
Lessons as Solo Solana Dev
- Bots Are Inevitable: X + crypto = instant scrapers. Layer defenses early.
- Automate Everything: HPA > manual scales. Observability next.
- Solana Synergies: Fast chain means app must match — Redis + edge caching critical.
- Solo Survival: Document incidents, build playbooks, sleep when you can.
Sharing this so other solo devs skip my pain. peace out ✌️